Reducing Support Dependency by Redesigning Insurance Self-Service Experience
Overview
Customers heavily depended on the support centre (~90%) for basic tasks like updating policy details, making claims, and tracking claim status.
Despite existing self-service features, 70% of users struggled to find what they needed online, especially when managing multiple policies—leading to poor adoption, high operational costs, and low retention.
Problem Statement
The digital experience failed to support users in completing simple, high-frequency tasks independently.
Poor discoverability, complex navigation, and fragmented journeys forced customers to rely on support channels, increasing costs and limiting opportunities for retention and cross-sell.
Business Goals
Reduce support centre volume and operational costs
Increase digital self-service adoption
Improve customer retention
Grow average policies per customer (1.5 → 2–3)
Enable cross-sell through better experience
My Role
Product Designer
Led end-to-end UX from discovery to solution design
Analysed customer, behavioural, and support data
Defined problem areas and prioritised opportunities
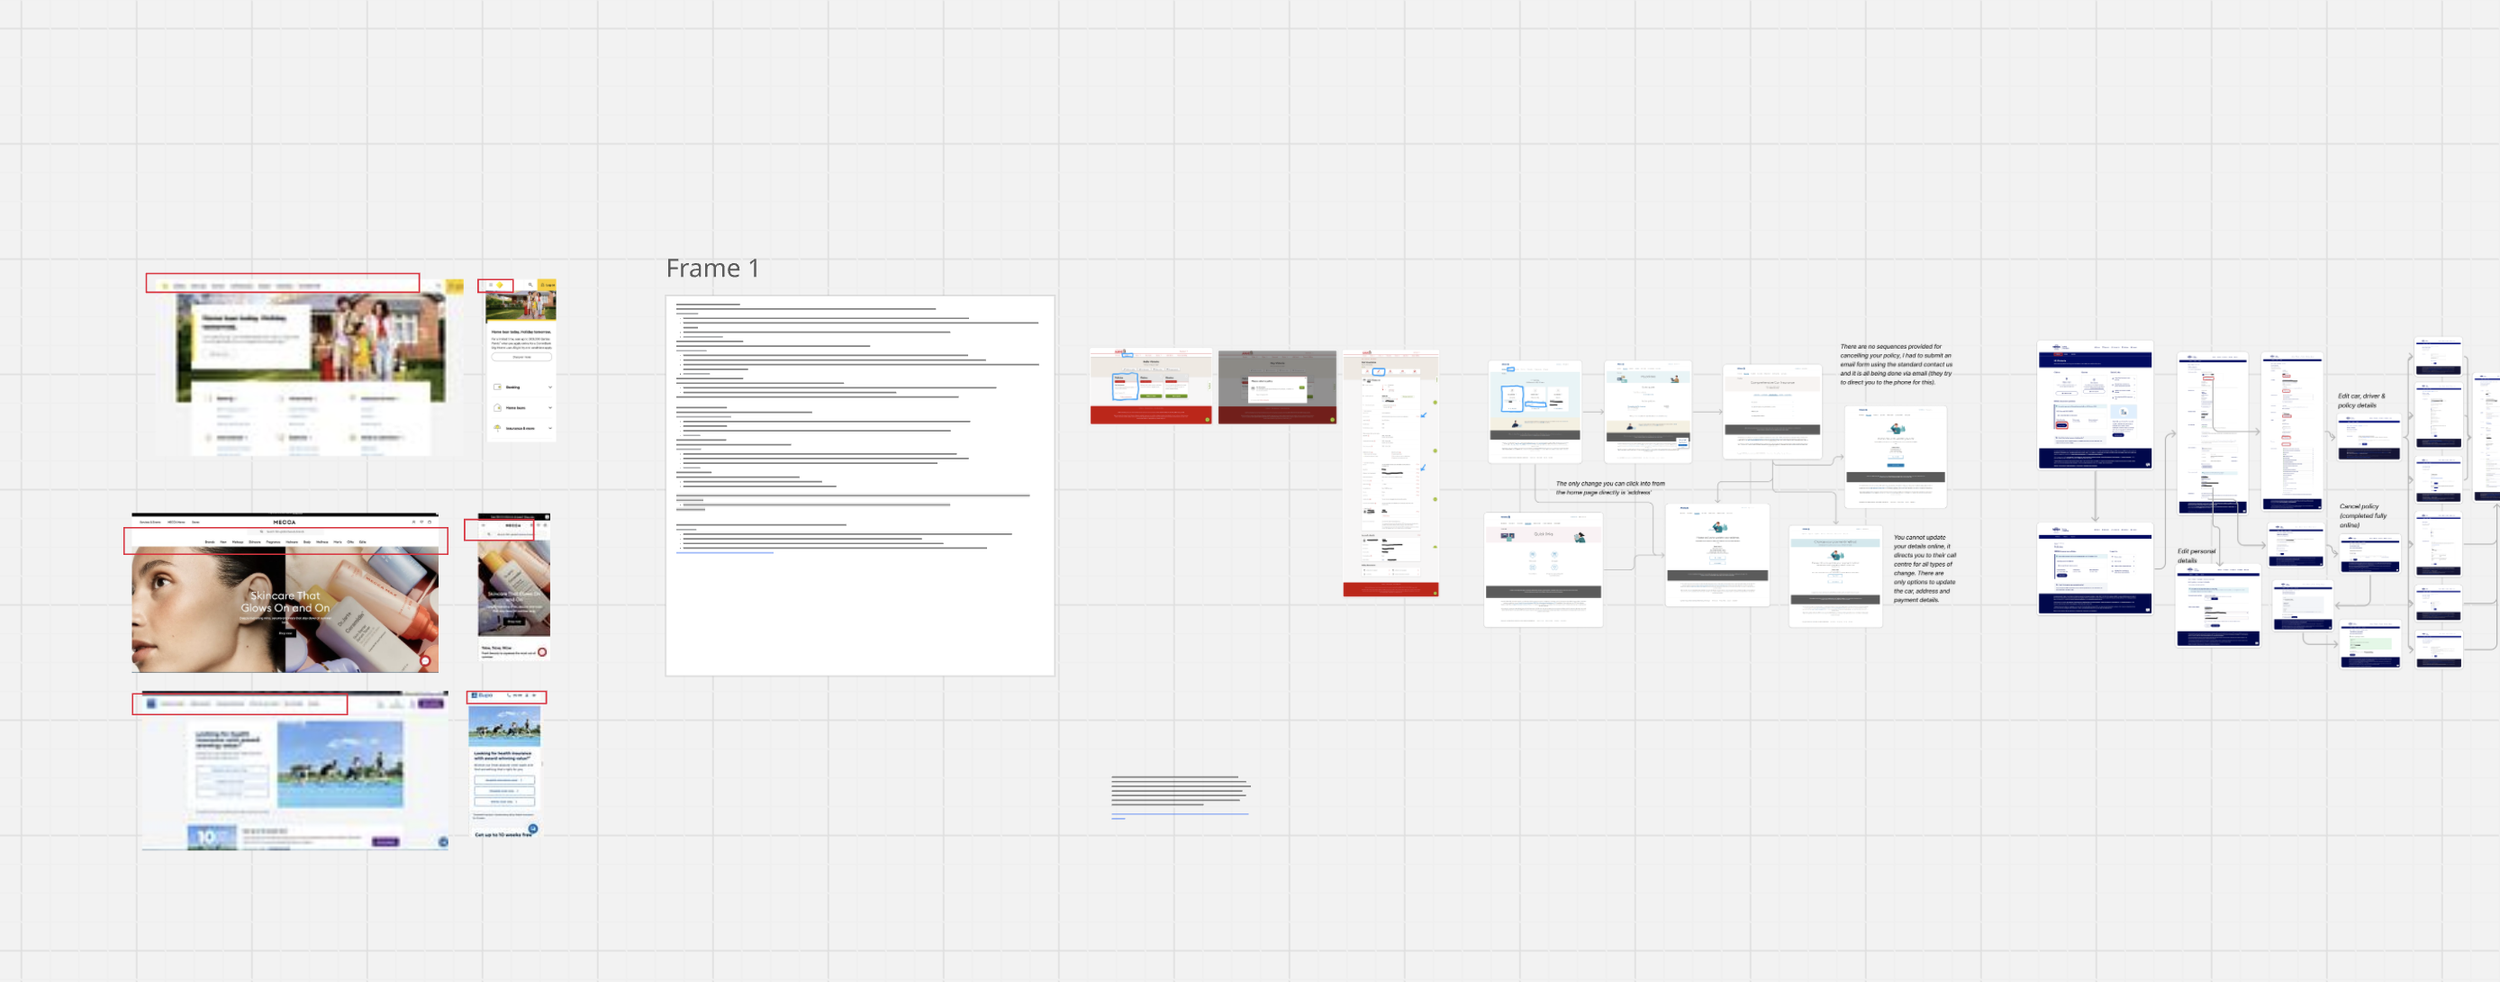
Discovery
Customer Research
Post-call surveys showed 7/10 users couldn’t find what they needed
Customers lacked confidence completing tasks online
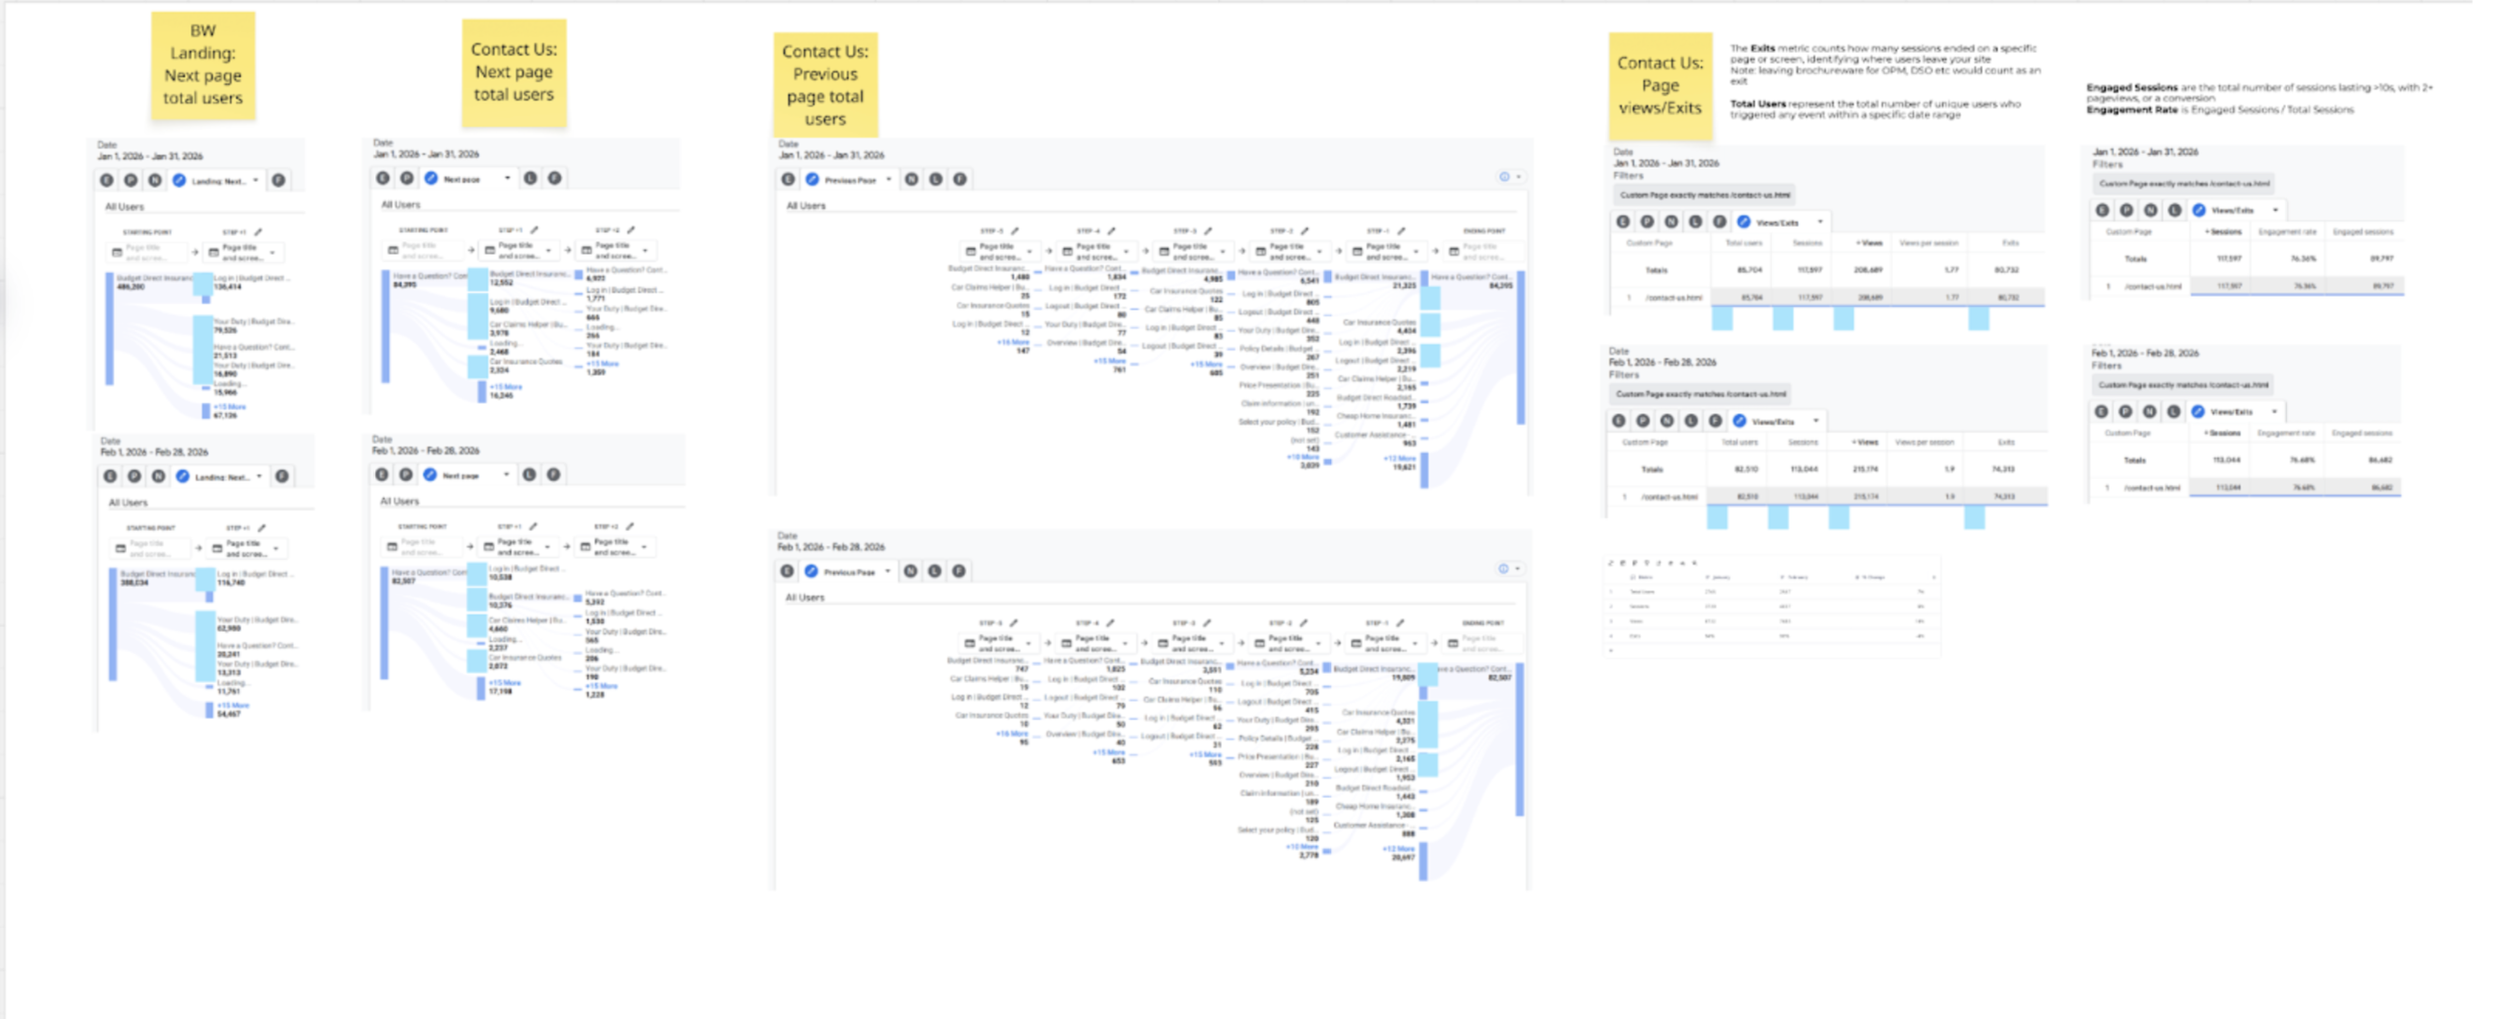
2. Support Data Analysis (Genesys)
Reviewed thousands of interactions to identify top reasons for contact:
Update policy details
Lodge a claim
Track claim status
👉 These were high-frequency, low-complexity tasks suitable for self-service.
3. Behavioural Analytics
High drop-offs in key journeys
Repeated navigation loops (users getting lost)
Low engagement with key actions
4.Key Insight
The problem wasn’t missing features—it was poor discoverability, navigation, and multi-policy complexity.
5. Key Challenges
Poor information architecture
Low visibility of critical actions
Fragmented user journeys
Complex multi-policy management
Lack of guidance and feedback
Low user confidence in digital channels
6. Opportunity Areas
Simplify navigation and prioritise key tasks
Create a unified experience for multi-policy users
Improve discoverability of high-intent actions
Build trust through guided flows and confirmations
Introduce personalised recommendations
7. Design Approach
Figma link: https://www.figma.com/design/zBl3jro9H9QXqscPDRvvDM/Global-nav--1-?node-id=0-1&t=kxpG9VZVDdY27vfO-1
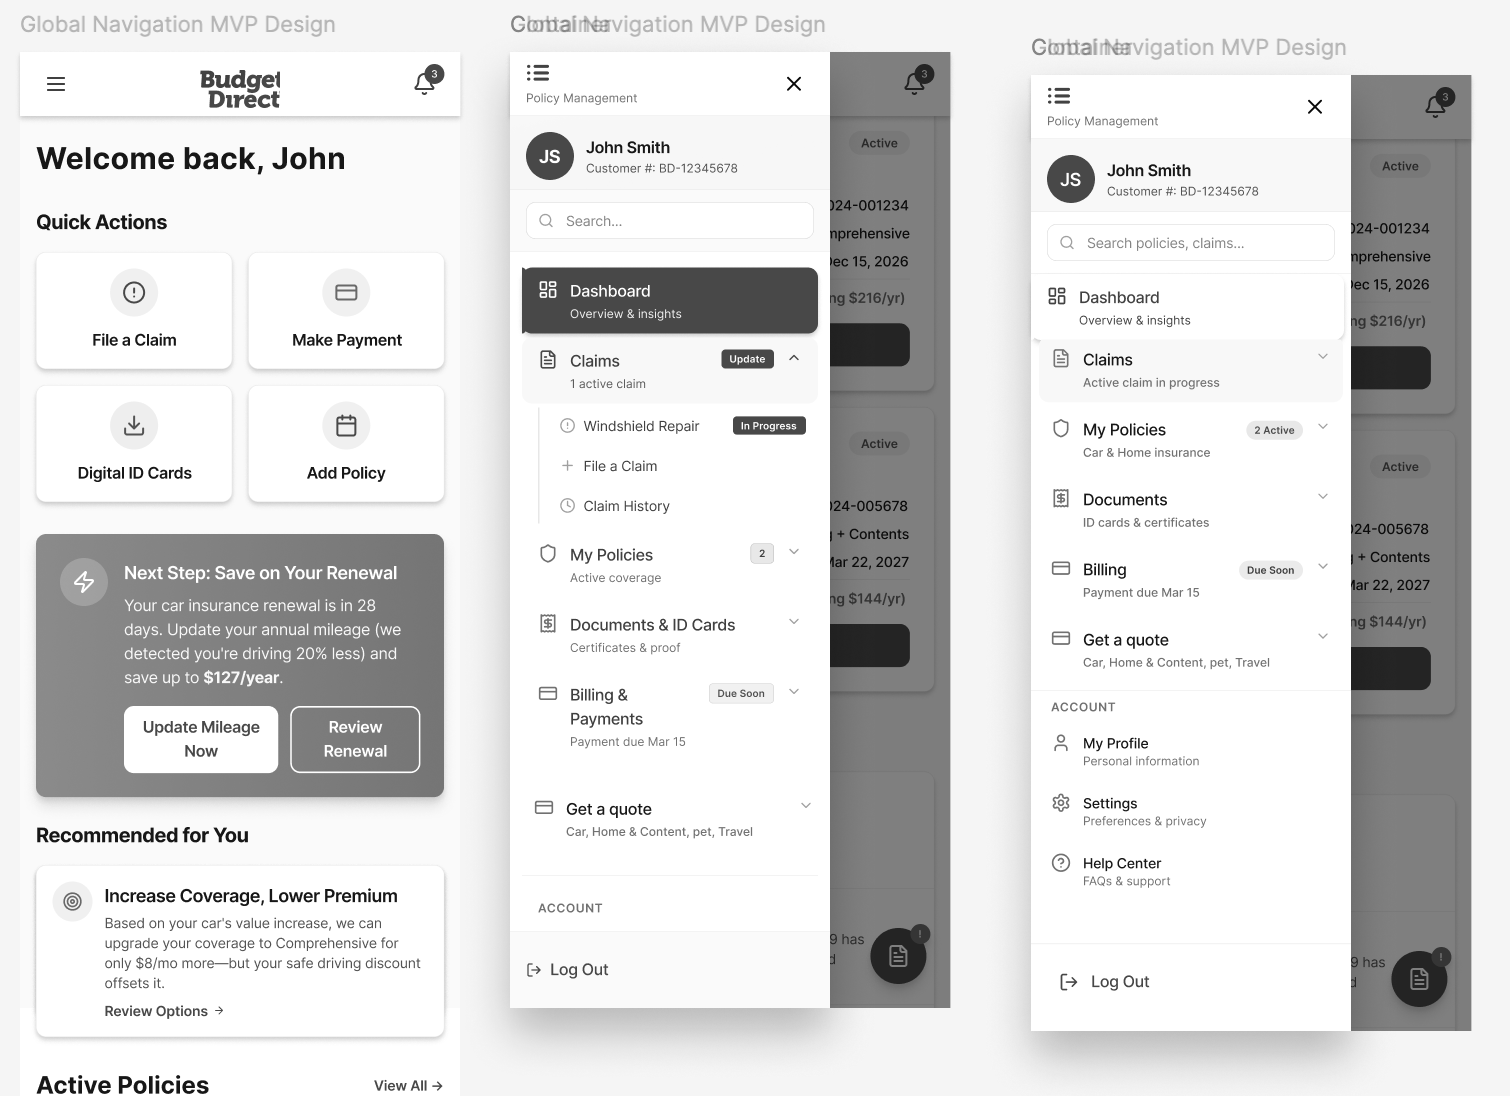
a. Information Architecture Redesign
Reorganised structure around user goals (tasks) instead of system logic
Reduced navigation depth
b. Task-Oriented Entry Points
Prominent CTAs:
“Make a Claim”
“Track Claim”
“Update Policy”
c. Multi-Policy Dashboard
Unified view of all policies
Enabled quick actions across policies
d. Guided Task Flows
Step-by-step claim and update journeys
Clear progress indicators
Instant confirmations
e. Personalisation & Value
Surfaced relevant policy recommendations
Highlighted savings and bundled offers
Impact (Expected Outcomes & Success Metrics)
Since the solution is not yet live, we defined success through measurable targets aligned to business and user goals:
↓ 20–30% reduction in support centre contacts for policy updates, claims, and status tracking
↑ 15–25% increase in digital task completion rates for key journeys
↑ 20–30% improvement in discoverability of primary actions (measured via CTR)
↓ 15–20% reduction in drop-offs and navigation loops across policy management flows
↑ 10–20% increase in engagement from multi-policy customers
↑ 10–15% improvement in customer satisfaction (CSAT/NPS) for self-service journeys
↑ 5–10% uplift in policies per customer through better visibility of offers and value
Learnings
Discoverability drives adoption more than feature availability
Designing for high-frequency tasks delivers maximum impact
Multi-product experiences need simplification and consolidation
Trust is critical—feedback and confirmation loops matter
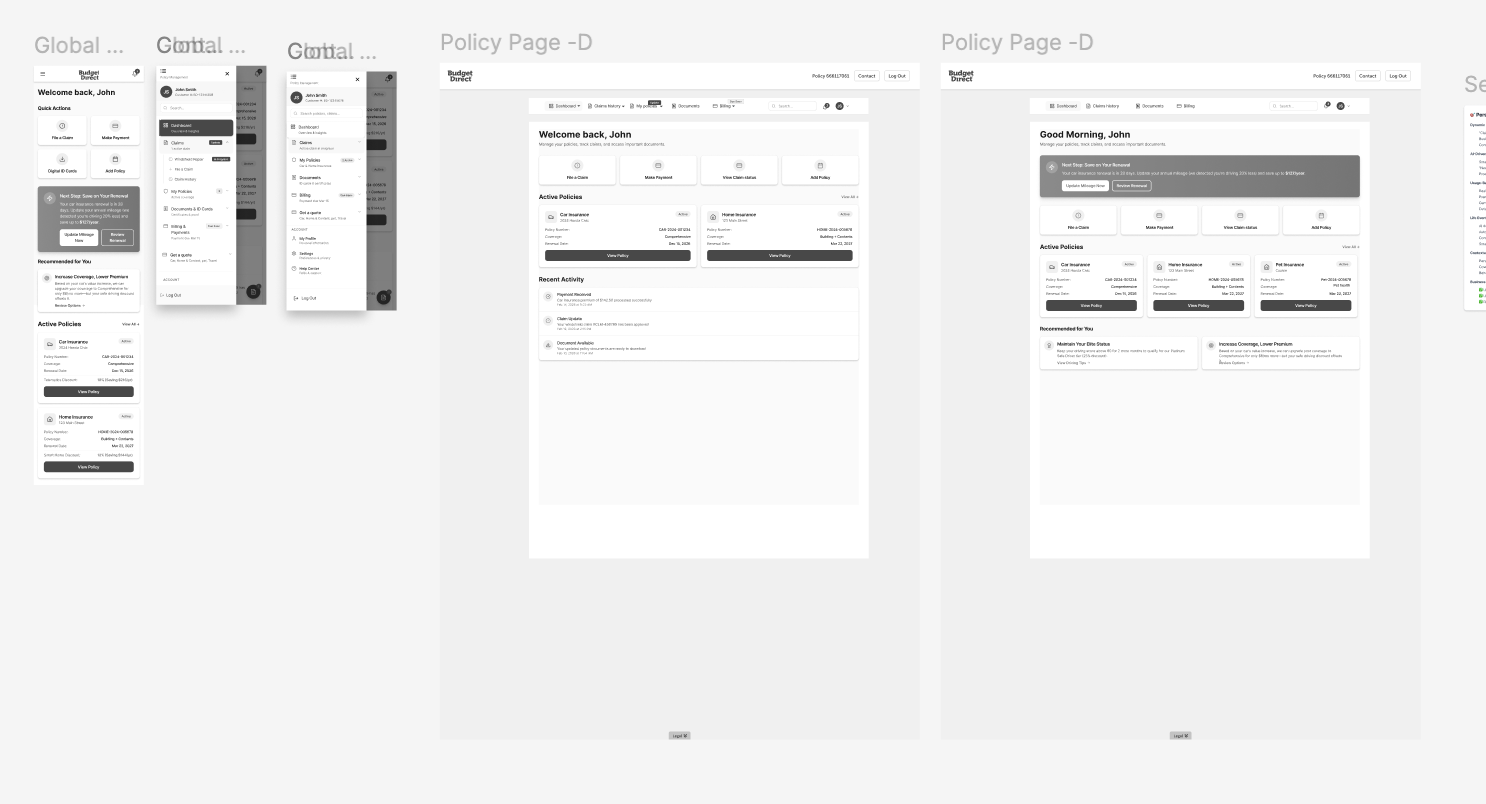
Task-Focused Customer Dashboard
To reduce navigation complexity, the redesigned experience introduced a task-focused dashboard that immediately presents customers with the most common actions.
Instead of requiring users to navigate through multiple menus, the dashboard surfaces primary actions such as:
Update policy details
Make a claim
Track claim status
Manage policies
Customers can now complete their tasks directly from the homepage without needing to search through the platform.
This approach aligns the experience with customer intent, helping users quickly accomplish what they came to the platform to do.
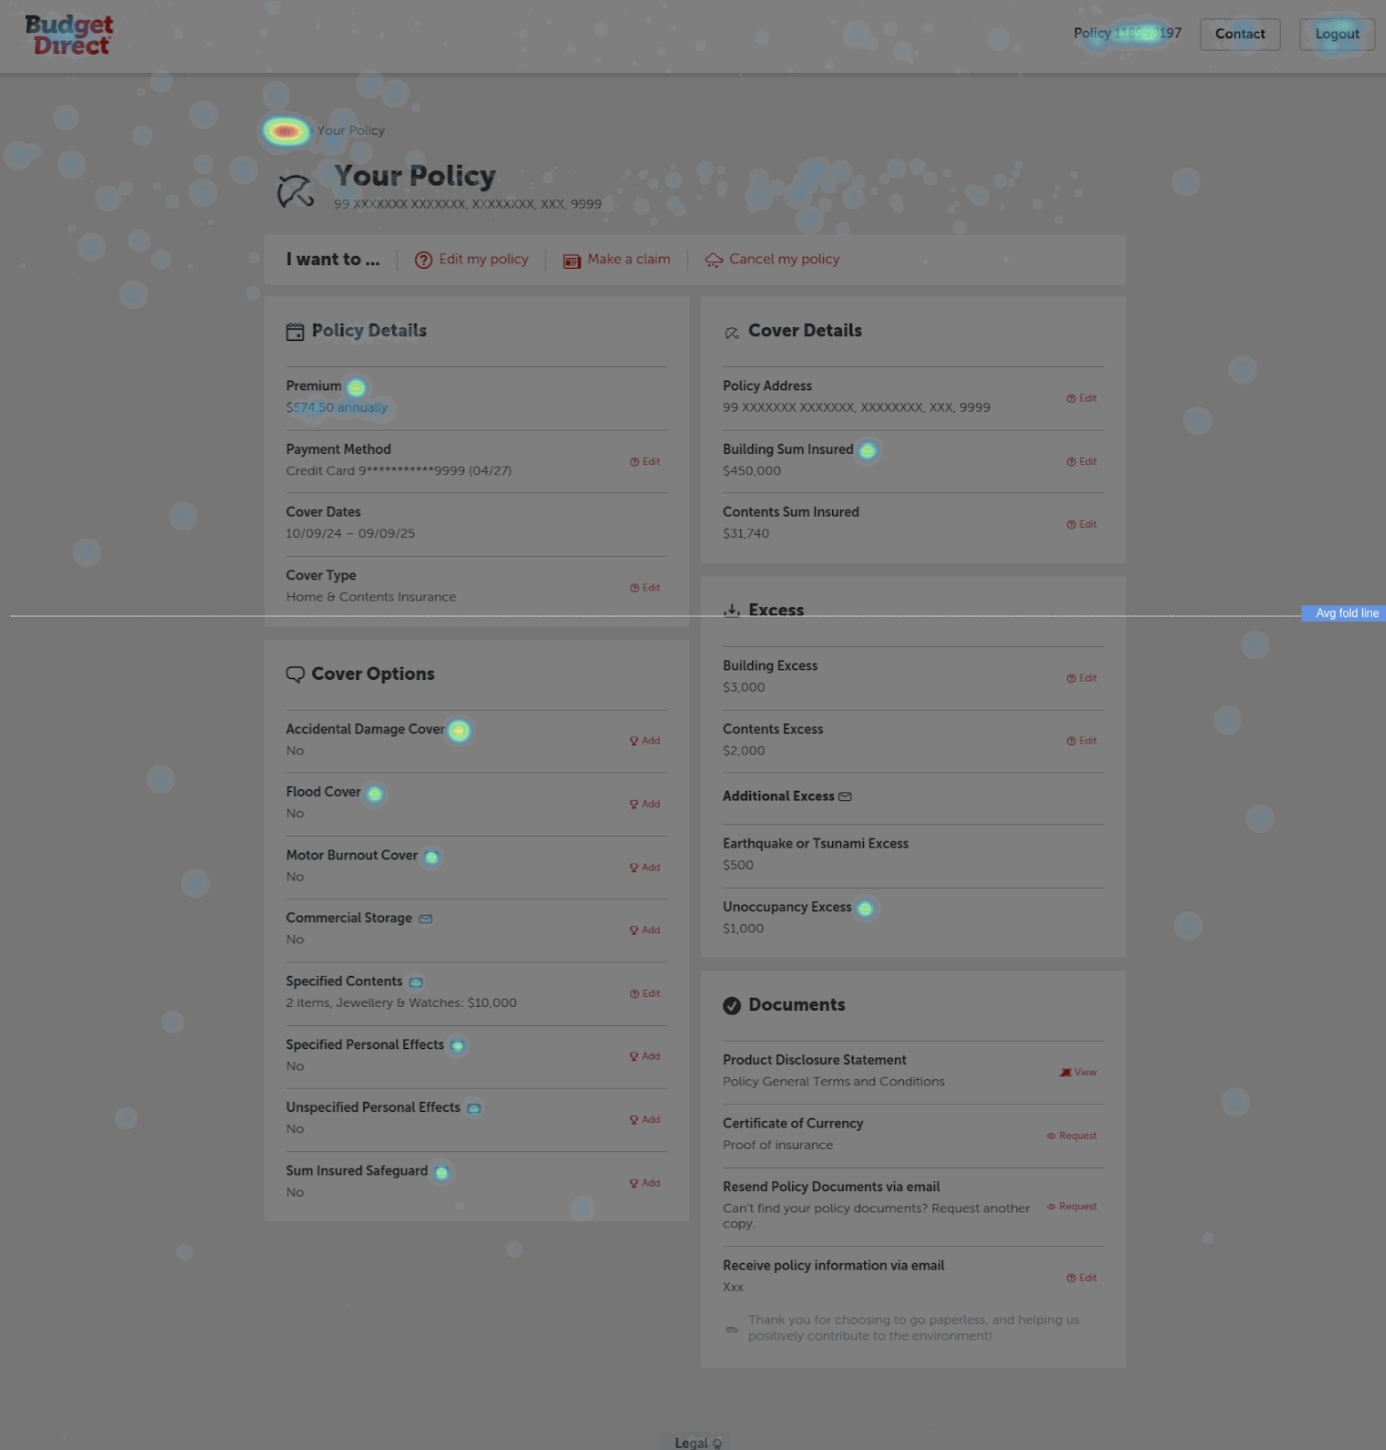
Unified Multi-Policy Management
Customers with multiple policies previously struggled to understand where to manage each policy. To solve this, the redesigned experience introduced a centralised policy overview.
This feature allows customers to:
View all their policies in one place
Easily switch between policies
Quickly access actions such as updating details or making a claim
Each policy is displayed with clear information and quick action options, reducing the need for customers to navigate through multiple pages.
This simplified structure significantly improves the experience for customers managing two or more policies.
Transparent Claim Tracking Experience
One of the most common reasons customers contacted the support centre was to check the status of their claims. To address this, a visual claim progress tracker was introduced.
The claim tracker shows customers:
The current stage of their claim
Completed steps
Upcoming steps
Any actions required from the customer
This gives customers clear visibility into their claim journey and reduces uncertainty, helping build trust in the process.
Simplified Claim Submission Flow
The claim submission process was redesigned to make it more guided and user-friendly.
Key improvements included:
Step-by-step claim submission
Clear progress indicators
Contextual guidance for required information
Ability to save and resume claims
This reduces confusion and improves completion rates for online claims.
Personalised Policy Recommendations
To support the business goal of increasing the average policies per customer, the dashboard also introduced personalised recommendations.
Customers are presented with:
Relevant bundled policy options
Opportunities to reduce premiums
Additional coverage suggestions
This helps customers see more value in their insurance portfolio while supporting the company’s retention and growth goals.
Expected Impact
35% reduction in policy update calls
25% increase in online claim submissions
20% faster task completion
15% increase in multi-policy adoption